Britain’s ever-changing second wave of Covid was today laid bare in a series of fascinating maps detailing exactly how the disease has spread since September.
Data released by Public Health England shows how the coronavirus has ravaged different parts of the UK since the outbreak took off again in the autumn.
Doncaster, Nottinghamshire, Rutland, Peterborough, Bolton, Luton and Slough are currently the worst-hit areas in the UK, with the East Midlands suffering the highest infection rate.
But the situation was drastically different at the start of the second wave in September, with the biggest outbreaks in the North West of England and parts of the West Midlands, Wales and Northern Ireland.
By the end of October, Lancashire, Liverpool, Manchester, Sheffield, Rotherham and Newcastle became the Covid hotspots.
However, the outbreak changed again in December because of the highly-infectious Kent Covid variant, which spread rapidly in the South East and London. South Wales was also hit badly for other reasons.
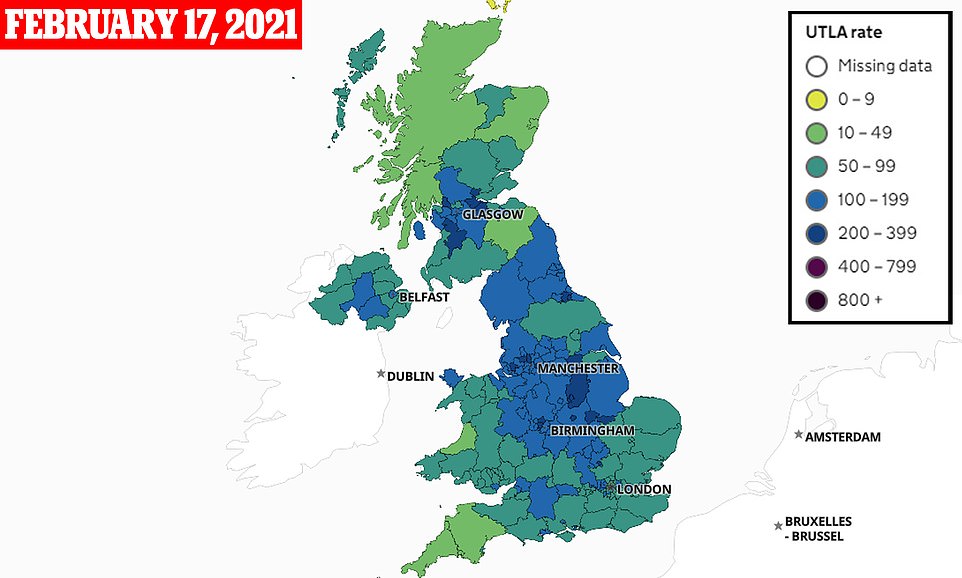
The most recent figures show the areas with the highest case numbers are Doncaster, Nottinghamshire, Rutland, Peterborough, Bolton, Luton and Slough as of February 17. Colours in the map represent weekly case numbers per 100,000 people, with dark blue representing between 200 and 399 and lighter blue meaning between 100 and 199


Cases were highest in the North West of England and parts of the West Midlands, Wales and Northern Ireland at the start of the second wave in September (pictured left, cases in the week up to September 2, right, up to September 9). Colours in the map represent weekly case numbers per 100,000 people, with dark green representing between 50 and 99 and lighter green meaning between 10 and 49


Hotpots began flaring in the North West of England and in South Wales in the week ending September 16 (left) before patches of the North East of England and the West of Northern Ireland caught up in cases in the week ending September 23 (right). Colours in the map represent weekly case numbers per 100,000 people, with dark purple representing more than 800 and lighter purple meaning between 700 and 799
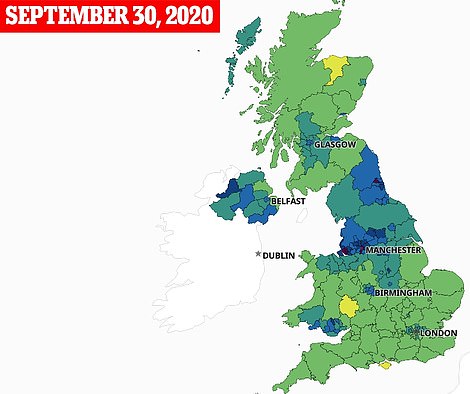
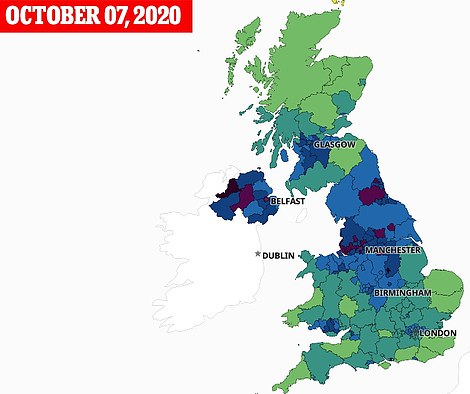
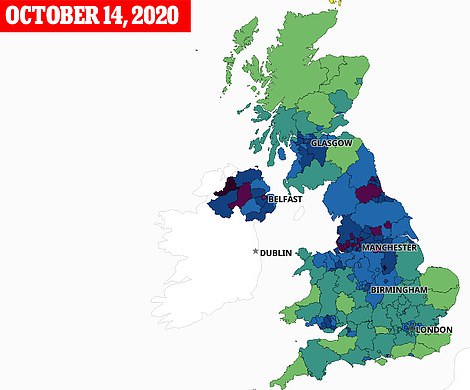
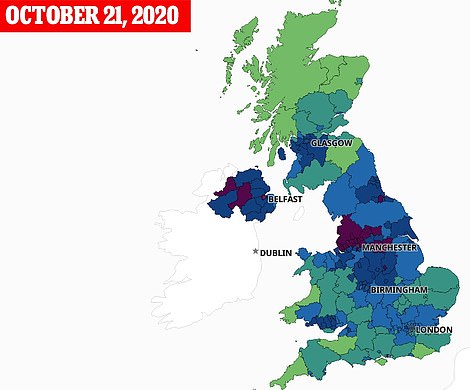
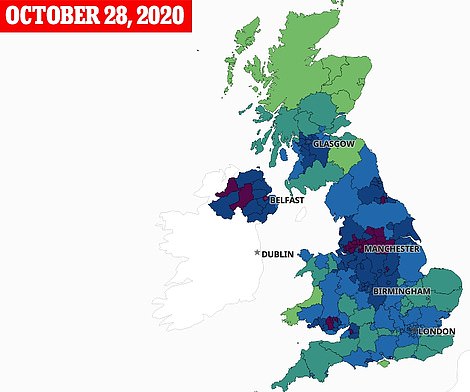
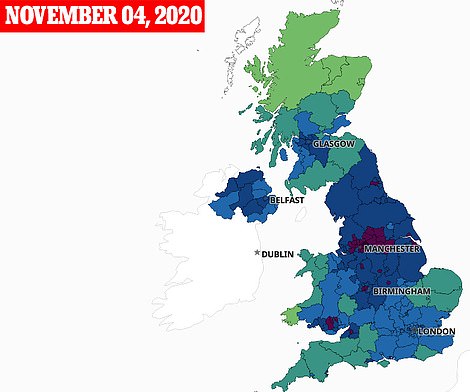
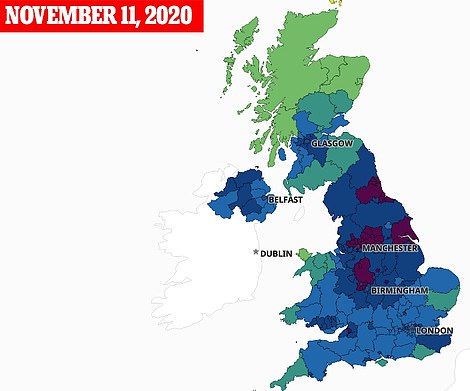
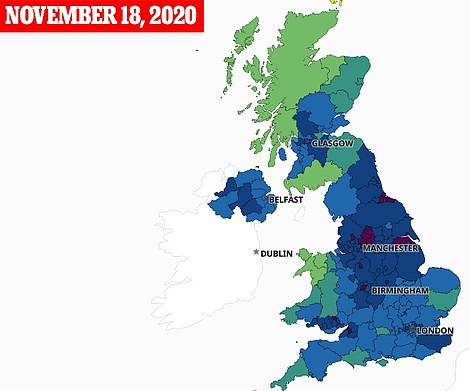
Cases were highest in the North West of England and parts of the West Midlands, Wales and Northern Ireland at the start of the second wave in September. By the peak of the second wave at the end of October, there were hot spots across Lancashire, Liverpool, Manchester in the North West, as well as Sheffield and Rotherham in South Yorkshire and Newcastle by mid-November
Weekly rolling rates of the coronavirus were higher in London, Essex, Kent and East Sussex than those suffered by hot spots earlier in September.
By the end of the month, rates hit more than 800 weekly cases per 100,000 people across those areas, as well as in Hertfordshire, Bedfordshire and Bridgend in Wales.
Further Covid clusters had emerged across swathes of the west of country by the middle of January, including in Shropshire, Cheshire, Liverpool, Lancashire and Cumbria.
But most of the UK saw cases fall by as much as 75 per cent by the end of the month, with the highest levels seen in the Midlands and North West.
The most recent data up to February 17 shows Doncaster, Nottinghamshire, Rutland, Peterborough, Bolton, Luton and Slough have the highest case numbers per population in the country.
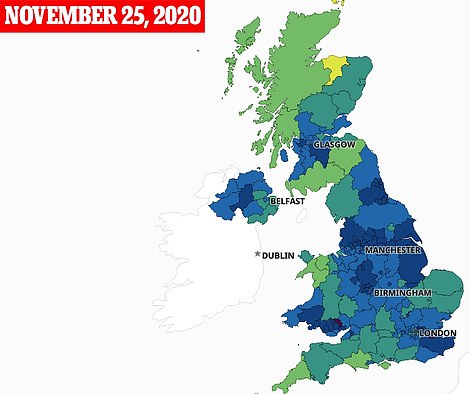
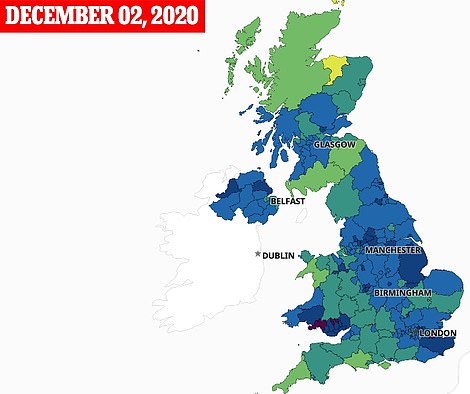
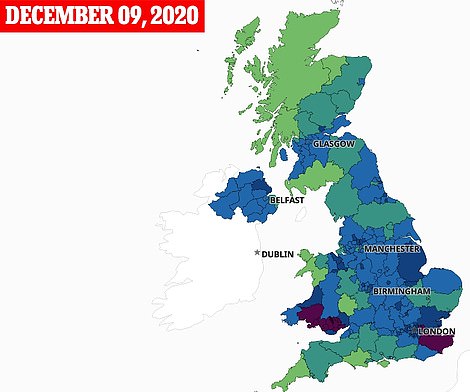
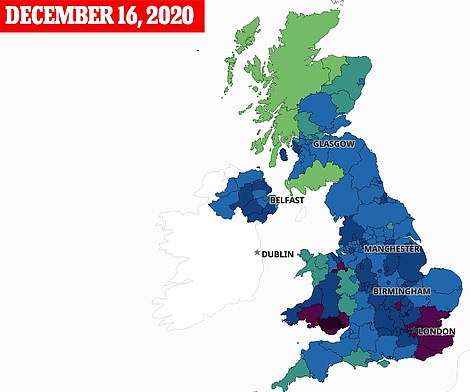
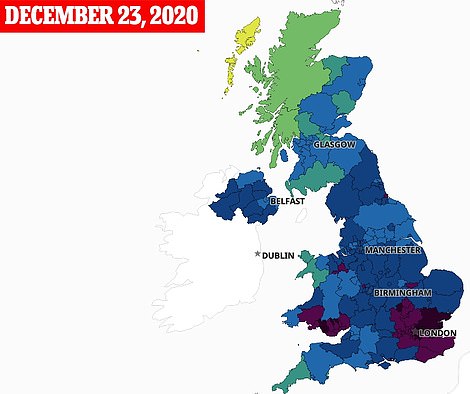
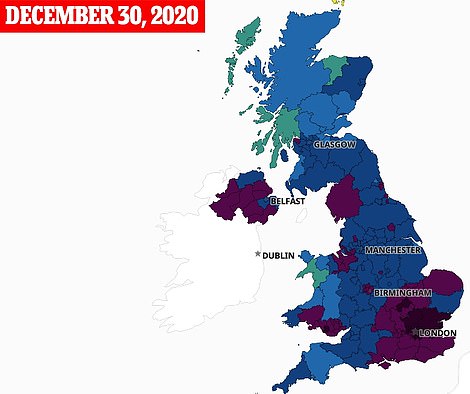
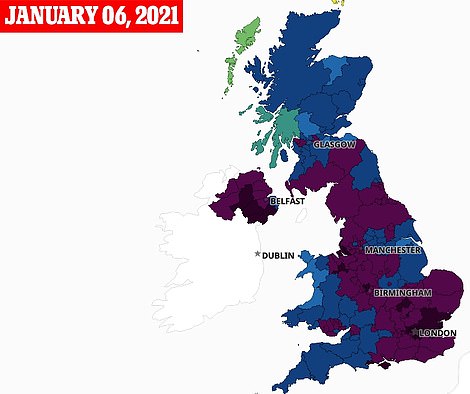
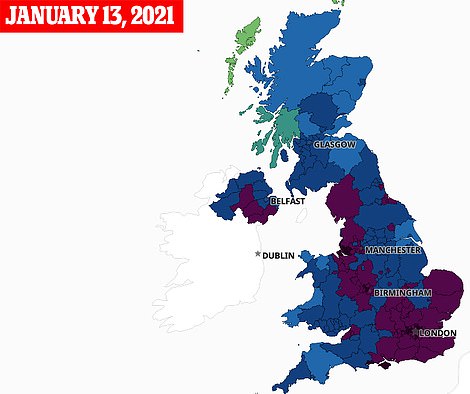
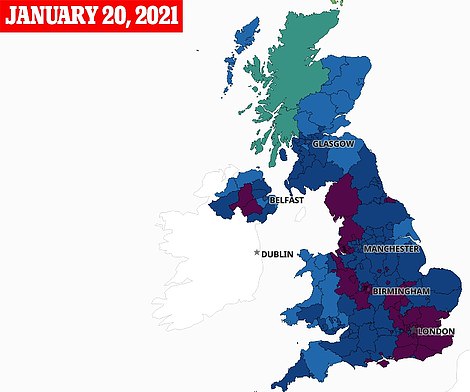
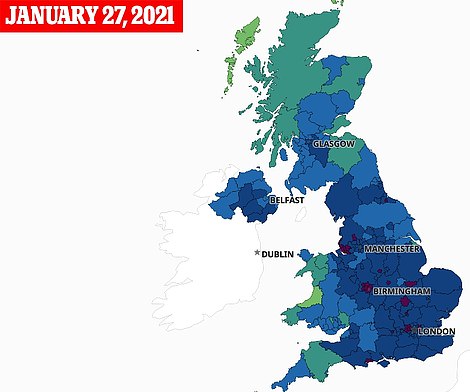
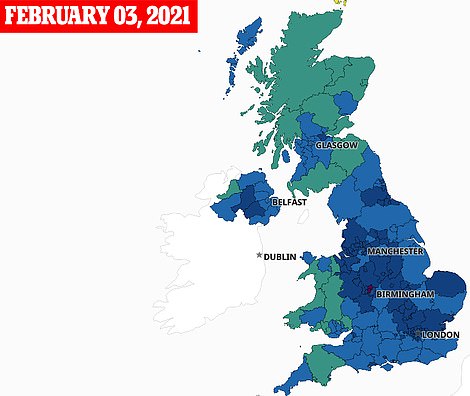
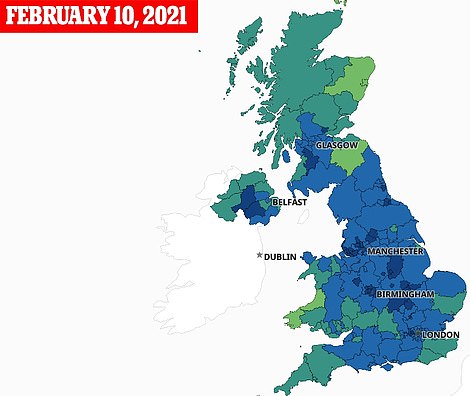
Hot spots had emerged across swathes of the west of country by mid-January, including Shropshire, Cheshire, Liverpool, Lancashire and Cumbria. But most of the UK saw cases fall by as much as 75 per cent by the end of the month, with higher levels seen in the Midlands and North West
Doncaster saw 650 new cases in the week leading up to February 17, a rise of 11.1 per cent. Nottinghamshire had 1,719 cases (down 12.7 per cent), while Bolton saw 663 (down 16.6 per cent).
It comes as official figures revealed today showed Covid deaths have fallen by almost a quarter in a week and have dropped for the second seven-day spell in a row.
Office for National Statistics (ONS) data showed there were 5,691 fatalities linked to the virus in England and Wales in the week ending February 12, which marked a 22 per cent dip from the previous period.
The number of people succumbing to the virus also declined in every English region, while deaths from all causes dropped by a tenth.
Covid fatalities fell in every region of England compared to the previous week, and none recorded more than 1,000 deaths from the virus for the first time this year.
The sharpest drop was in the South East where they fell by 31 per cent (974 Covid deaths recorded), followed by London where they dropped by 27 per cent (718) and the East of England where they fell by 26 per cent (808).
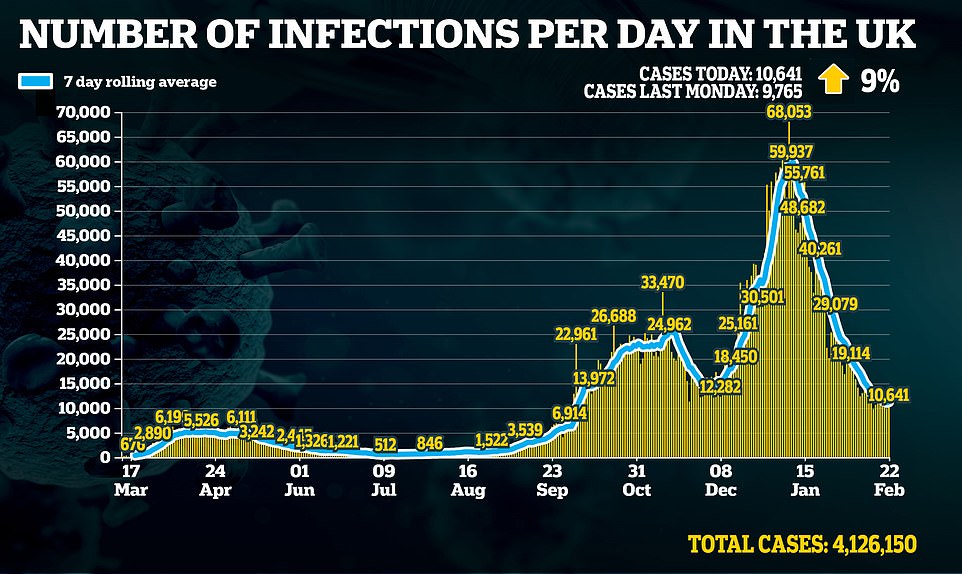
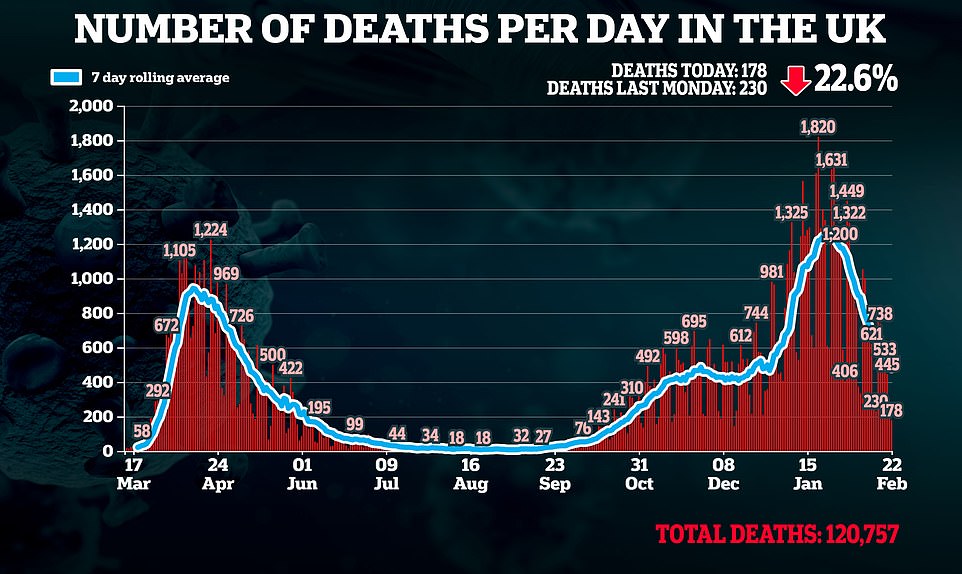
These regions were the first to enter the harshest measures in the run-up to Christmas due to surging outbreaks of the more infectious mutant Kent variant. Others did not enter harsher measures until after the new year.
But in the East Midlands they declined by just one per cent compared to last week after 557 were recorded, compared to 564 the previous week.
Deaths from all causes also remained above the five-year average – the number of deaths that would be expected at this time – in all English regions, highlighting the death toll triggered by the virus and the disruption to routine healthcare after wards were turned over to handle Covid patients.
London’s deaths were 42.4 per cent above the levels expected (460 extra deaths). In the East Midlands they were 42.2 per cent higher than expected (432) and in the East of England they were 42 per cent higher (552).
In Wales the number of Covid deaths also fell by 31 per cent from 314 to 216, ONS data showed. Deaths in the devolved nation from all causes were above the five-year average, however, by 4.3 per cent (31 extra deaths).
Source link : https://www.dailymail.co.uk/news/article-9265393/How-Britains-second-wave-Covid-drastically-changed.html


